RACCOON HISTORY - UNITED STATES
PRE - COLONIZATION ERA OF THE RACCOON
In North America, Native Americans regularly hunted raccoons as food and for their fur, which they used to make clothing. Fur from various mammals, including raccoons, was used by certain indigenous people to create hats. The size of the pelt and the thickness of the fur made raccoon pelts an attractive choice for hat-making. The raccoon’s tail, often left attached to a pelt, became a prominent component of these caps. In addition to being part of one’s normal hunting attire and a means to stay warm in the winter, possession of a “coonskin cap” sometimes conveyed special status within a tribe.
Native Americans used more traditional trapping methods, such as basic snares, pit traps, and deadfalls. In the early 16th century, European settlers brought metal trapping devices with them and established the North American fur trade with Europe. The fur trade was the main source of commerce for settlers and funded the extended period of colonization.
COLONIZATION ERA OF THE RACCOON
Around 1550, the "Beaver Era" started and would last for about 300 years. The beaver population at the time was prosperous and widespread throughout almost all of New York State. Pelts were treasured for their warmth, texture, and durability, so many were traded, sold, or used in clothing production. Other furbearers were trapped during "The Beaver Era," including the bobcat, badger, muskrat, RACCOON, river otter and coyote.
Early colonial settlers used raccoons as a source of fur and meat during the 1600s, a practice that continued through the 1800s. Raccoon fat was used as a lubricant, leather softener, and replacement for beef lard. Although raccoon pelts were not as prized as those from beaver, they still became objects for trade and bartering in poorer rural areas. As was true for Native Americans, settlers also made coonskin caps, which became an iconic image of frontiersmen like Davy Crockett and Daniel Boone.
Early settlers also brought the European tradition of hound hunting to the New World in the 1600s, where hunting success was enhanced by relying on the dogs’ keen senses of sight and smell. Since raccoons first appeared in written records in 1612.
FRENCH FUR TRADE OF THE RACCOON
The 1600’s - France’s claim to Canada and neighboring areas dates back to 1535 when Jacques Cartier discovered the St. Lawrence River and sailed to the site of what is now Montreal. In 1608 Samuel de Champlain arrived as governor, and settlement began.
Many of those first immigrants found the fur trade an easier and more profitable existence than the drudgery of farming. To control the trade, a string of outposts was established, some where missionaries had already settled. Years before Detroit was founded, several of these forts, or trading posts, were flourishing in Michigan: Sault Ste. Marie (1668), Fort de Baude at St. Ignace (1686), Fort St. Joseph – where Port Huron is now (1686), one in St. Joseph (1679), and one in Niles (1691).
Before long, Cadillac reported that 2000 Indians had set up their living quarters in the area, and others were coming in to trade their furs. The pelts that were shipped from Fort Pontchartrain of Detroit included bear, elk, dear, marten, RACCOON, mink, lynx, muskrat, opossum, wolf, fox and, of course, beaver. Within a rather short time, Detroit was established as the center of the Great Lakes fur trade.
ENGLISH FUR TRADE OF RACCOON
The 1700’s - For the next forty years the prices for goods in Detroit were quoted in terms of beavers or bucks a buck was a buckskin, the hide of one large, prime, male deer.
The British decreed that one beaver pelt was worth one good buckskin or one small buckskin and one doeskin.
One small beaver was worth one marten or two RACCOONS, while one large beaver might be worth as much as six RACCOONS
The Commandant at Detroit in 1772 described the traders as “a sad set, for they would cut each others’ throats for a raccoon skin”
HUDSON BAY COMPANY FUR TRADE OF THE RACCOON
Hudson Bay Company from the 1800s and early 1900s, hunters and trappers in the U.S. sold an average of about 3,500 raccoon pelts to the Hudson Bay Company annually.
By the mid-1940s, annual national pelt sales to the Hudson Bay Company had increased to 1 million, but ultimately rose to nearly 2 million by the early 1960s.
UNITED STATES FUR TRADE OF THE RACCOON
- The Raccoon U.S. harvest averaged about 360,000 per year in the 1930s, increased to about 900,000 per year in the 1940s, and increased further to 1.3 million pelts per year in the 1960s (40 times greater than the Canadian harvest).
In the 1970s the U.S. harvest more than doubled to 3.1 million pelts, and thus far in the 1980s the harvest has averaged about 4.2 million pelts per year (26 times greater than the Canadian harvest).
The Raccoon populations, although they had declined to low levels by the 1930s, then experienced a continent-wide population explosion from 1943 to the late 1940s. Since that time, high population levels have been maintained to such an extent that the raccoon range has expanded to include areas where they were rare or absent during the 1930s.
Hence the large harvest of raccoons during the 20th century is mainly a reflection of the increase in the sizes of raccoon populations.
Additionally, in the 1920s, 1930s, and 1940s, raccoon coats were extremely popular in the United States, especially among college students, and this popularity has continued to the present partly as a result of the moderate price of raccoon coats.
The total North American yearly average harvest of more than 4.4 million pelts in the 1980s makes the raccoon harvest the most valuable of all North American furbearers. The value of the North American harvest of raccoons was estimated to be about $94 million (CDN) in 1982–83, about 3.3 times greater than the value of the second most valuable species, the muskrat ($28 million CDN).
Feb 2023 - International source - The harvest of raccoon for United States fur value is the lowest it has ever been, less than 100,000 and could be far less.
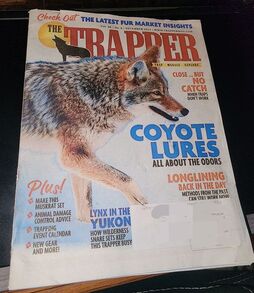
The Trapper
December 2023
Latest Fur Market Insights
Raccoons remain at dismal prices until Russia comes back to table. Until war is over it won't happen.
I cannot see raccoon prices going upward for the NEXT THREE YEARS!
In the 1970s the U.S. harvest more than doubled to 3.1 million pelts, and thus far in the 1980s the harvest has averaged about 4.2 million pelts per year (26 times greater than the Canadian harvest).
The Raccoon populations, although they had declined to low levels by the 1930s, then experienced a continent-wide population explosion from 1943 to the late 1940s. Since that time, high population levels have been maintained to such an extent that the raccoon range has expanded to include areas where they were rare or absent during the 1930s.
Hence the large harvest of raccoons during the 20th century is mainly a reflection of the increase in the sizes of raccoon populations.
Additionally, in the 1920s, 1930s, and 1940s, raccoon coats were extremely popular in the United States, especially among college students, and this popularity has continued to the present partly as a result of the moderate price of raccoon coats.
The total North American yearly average harvest of more than 4.4 million pelts in the 1980s makes the raccoon harvest the most valuable of all North American furbearers. The value of the North American harvest of raccoons was estimated to be about $94 million (CDN) in 1982–83, about 3.3 times greater than the value of the second most valuable species, the muskrat ($28 million CDN).
Feb 2023 - International source - The harvest of raccoon for United States fur value is the lowest it has ever been, less than 100,000 and could be far less.
The Trapper
December 2023
Latest Fur Market Insights
Raccoons remain at dismal prices until Russia comes back to table. Until war is over it won't happen.
I cannot see raccoon prices going upward for the NEXT THREE YEARS!
Do you know YOUR states predator prey history?

What is your state high mark to today raccoon numbers?
STATE of the STATE Raccoon Harvest -
Iowa - 300,000 in 2011 to 34,000 in 2021.
Illinois – 141,000 in 1979 to 134,000 in 1987 to 35,000 in 1991.
Arkansas – 78,000 in 1996 to 21,000 in 2013 to 1,600 in 2021.
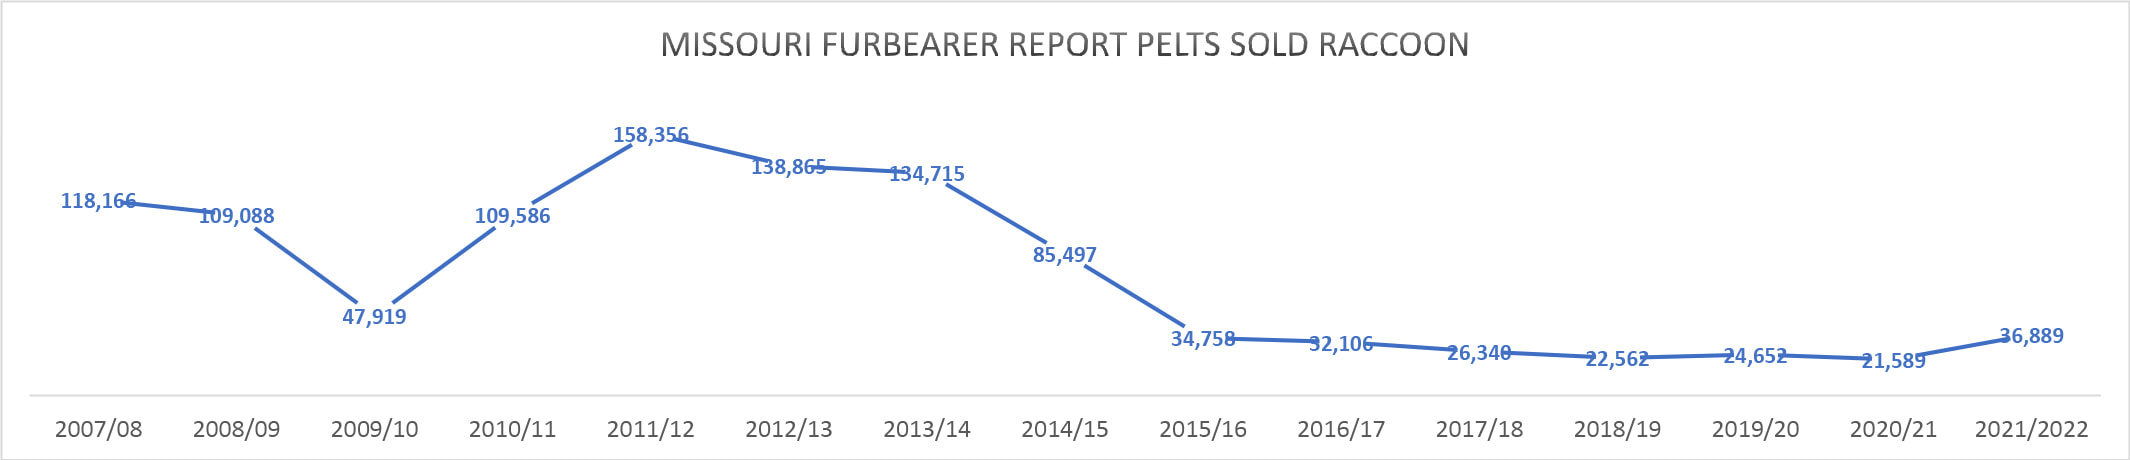
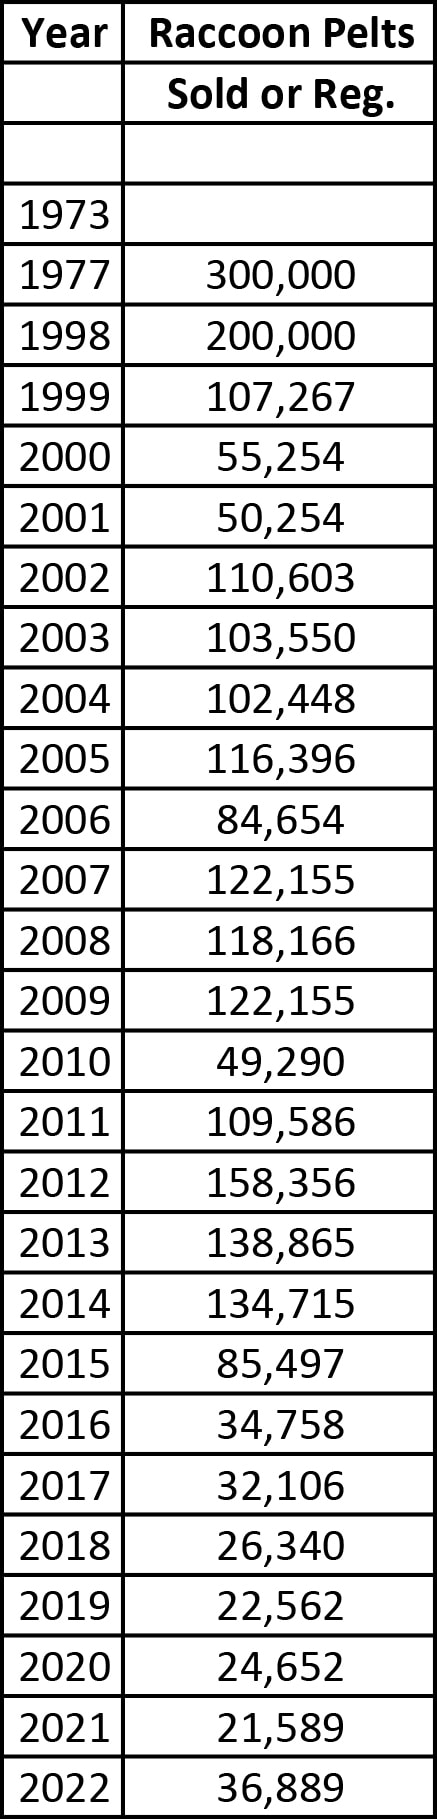
Missouri – 300,000 in 1977 to 200,000 in 1998 to 150,000 in 2012 to 21,000 in 2021 Raccoon Pelts sold.
Virginia, raccoon harvest reached a maximum (118,950 pelts) during the 1980-81 season. The highest average pelt price ($22.32) was reached several years earlier during the 1979-80 season (adjusted for inflation, this average was $87.57).
Missouri - PREDATOR HISTORY
1940 – 1941 – 834,935 pelts harvested (most pelts sold) (over 70% were opossum and skunk pelts) most pelts sold
1945 – 1946 – Missouri Fur Dealer Permit 1,192
Raccoons – A Natural History - Zeveloff, p. 98 - Biologist Allen Twichell and Herbert Dill reported the highest raccoon density known to occur: During the winter of 1948, 100 were removed from den trees on 41 ha (102 acres) tract of Swan Lake National Wildlife Refuge, a waterfowl reserve on a Missouri Marsh, yielding an astounding density of about 1 raccoon per acre or nearly 250 km2.
Missouri Raccoon population indicated that it could replace itself in 7.4 years.
1979 – 1980 – 634,338 (2nd highest pelts sold - when average raccoon pelt values were estimated at $27.50.
1997 – 1998 – Over 200,000 Raccoons were trapped.
1980 – 1981 – 13,248 trapping permits sold in the state of Missouri
2009, MDC estimated the statewide raccoon population at 1.4 million with annual trapping of 100,000 to 200,000.
In 2010, MDC estimated the statewide raccoon population at 1 to 2 million with annual trapping of annual trapping of 100,000 to 200,000.
2017 – 2018 – Just Over 26,000 Raccoons were trapped.
2017 – 2018 – Only 7,189 trapping permits sold in the state of Missouri.
2018 - 2019 – 6,956 trapping permits sold in the state of Missouri
2018 - 2019 – Raccoon totaled 22,562 trapped
2018-19 season resulted in the lowest raccoon harvest since 1942 and the longest duration of decline in harvest numbers over the last 25 years with seven consecutive years of decline.
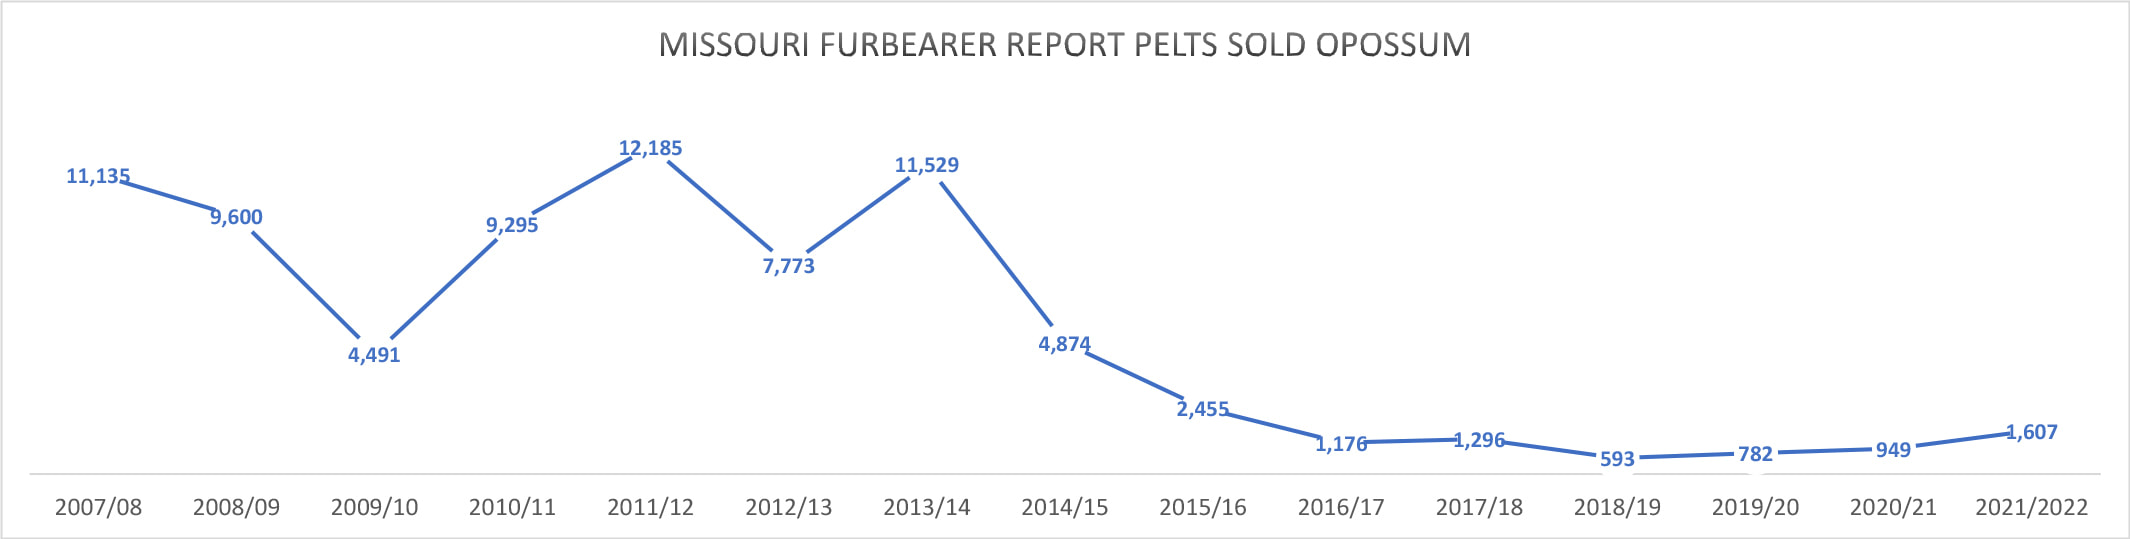
2018- 2019 – Opossum harvest totaled 593 lowest opossum harvests on record.
2018- 2019 – Skunk also resulted in the lowest Skunk harvest since 2000-01 only 156.
2018 – 2019 - Coyote population appears to be on a slight increase since the 1970s.
2018 -2019 - Bobcat season was down 28.40% from 2017-18 The decline in harvest and in the number of bobcat pelts purchased by fur dealers also is likely attributed to a poor global fur market.
2019 - 41 Fur Buyer Permits
2019 - 2020 - Trapping numbers and prices this year still falling.
2020-21 - Raccoon harvest in totaled 21,589 and included individuals harvested by both trapping and hunting methods. The 2020-21 season resulted in the second lowest raccoon harvest since 1942.
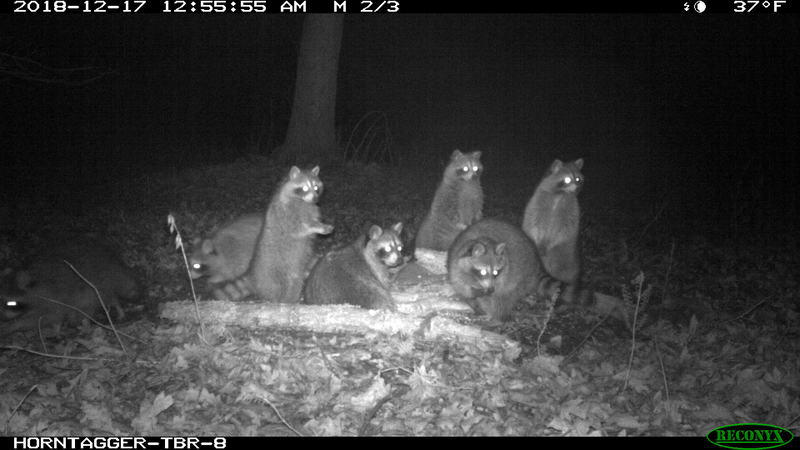
Why does this matter? Because we are current in un-natural high predator population!
NEST PREDATOR CAPTURE
2021 - Raccoon Count, Site 1 - 1.57 per acre, Site 2 - 2.02 per acre, Site 3 - 3.34 per acre
2021 - Opossum Count, Site 1 - .65 per acre, Site 2 - 1.11 per acre, Site 3 - .93 per acre
2022 - Raccoon Count, Site 1 - .50 per acre, Site 2 - .09 per acre, Site 3 - .40 per acre, Site 4 - .07 per acre
2022 - Opossum Count, Site 1 - .18 per acre, Site 2 - .27 per acre, Site 3 - .25 per acre, Site 4 - .03 per acre
Skunks, Foxes, Coyote, Bobcats exist but no count is shown.
Armadillo’s, Bears, and Wild Hogs do not exist in this research area in Missouri
VIRGINIA OPOSSUM HISTORY
Prior to the 20th century the average annual harvest of opossums by American companies increased from slightly more than 34,000 pelts in the 1850s to more than 546,000 in the 1890s.
In the 20th century the opossum usually has been harvested in greater numbers than most other furbearer species. For example, in the 1970s and 1980s, only raccoons, muskrats, and nutrias were harvested in greater numbers than opossums.
An average annual harvest of nearly 1.4 million pelts was taken in the 1930s and an average of 1.6 million was taken in the 1940s. The harvest dropped to slightly more than 340,000 in the 1950s and 180,000 in the 1960s, then increased greatly to more than 940,000 by the 1980s.
Although the harvest of opossums is large, it is probably largely incidental to the capture of other furbearers. Hence the large increase in the harvest of opossums since the 1960s may reflect increases in population sizes of opossums.
Prior to European settlement the northern limits of the Virginia opossum were Kentucky, Indiana, and Ohio, but during the last century the range of the opossum has expanded northward and westward. The distribution of the opossum on the western coast of North America resulted from planned introductions and escapes from captivity in the late 1800s and early 1900s.
The opossum held the foremost position in the fur trade among marsupials because quantities obtainable were large and the pelts could be dyed to simulate the appearance of higher price pelts.
You think you know Opossum is just another EGG EATER with a population 2 or 3 times more than Raccoons giving birth to around 18 to 20 but only 13 can nurse, the rest just fall off and die.
They disperse more ticks across your property in a day than they eat in a lifetime.
Opossum are scent hunters that’s why they find and eat on dead animals and love wet spring, nothing like the smell of a wet hen.
The earliest research (1851) was by John James Audubon2, which described the stomach contents of an opossum that he had shot and gutted in the woods. Subsequent research was more comprehensive, especially a paper by Bill Hamilton3 that described the diet items of 186 opossums much in the same manner we were doing: recording the amount of each type of insect, flower and vertebrate species found. In total, the literature presented the results of diet analysis of over 1,280 opossums from across their range in the United States. Not a single paper reported ticks being found in the stomachs, or in any other section of the gastrointestinal tract, of Virginia opossums.
Although the number of opossums harvested typically has been higher than most other furbearers for most of the 20th century, the average pelt price for the opossum in both 1982–83 and 1983–84 exceeded only that of red squirrels and weasels. In the 1940s, European markets usually dyed the pelts to simulate skunk pelts and then used them as they used skunk pelts. Harding (1915) also noted this practice and concluded that the price of opossum pelts fluctuated and was largely governed by skunk prices. This may partially explain why the harvest of opossums was at its lowest levels during the 1950s and 1960s, when skunk harvests were also low.
Do you know your states of the state Opossum and Skunk Harvest?
Missouri – “Opossums and Skunks” 500,000 in 1940 – Skunks Only 700 in 2006 to Opossum Only to 12,000 in 2012 to Opossum Only 942 in 2021 to Skunks Only 221 in 2021
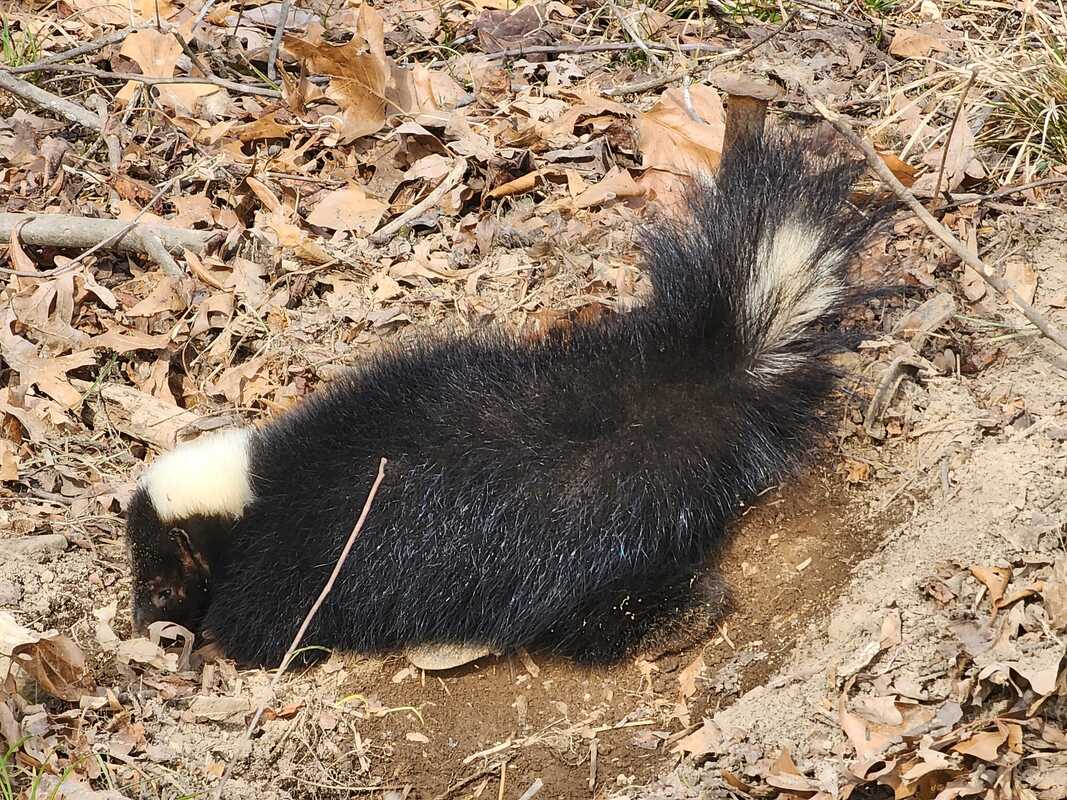
SKUNKS HISTORY